GAIT AND HEIGHT ANALYSIS |
|
Our first project of Senior Engineering was Gait and height analysis.
"Gait analysis" is the systematic study of human motion, using visual observations and movement measurements
The objective of this project was to understand what properties of a walking gait could be utilized to identify different types of people and what possible measures related to the human gait could be utilized to quantify that gait.
In order to accomplish this objective, we used accelerometers to collect and graph acceleration vs. time data that can help in gait analysis.
Then we compared our gait analysis by graphing each groups' data.
|
Class Gait Analysis
(Class Data) https://docs.google.com/spreadsheets/u/1/d/150b1-yV3A_sxjVM_x5nBJOxQmjUJ6iwnHH4JuQfsgto/edit?usp=drive_web Height Prediction Model
https://docs.google.com/document/d/1hS-6TwoKtgGlT-tzbRhwCY_DsdDF2296-XU__1eqLoI/edit Through comparing the class gait data, I realized how a taller a person is, the less amount of steps they took. I also learned how to read the graph; every bump in the graph, that represents each steps.
It was hard to compare between each gait data because everyone had different variables to begin with. For example, every had different distance walked, amount of steps took, and places where they put the phone. However, in order to compare the datas, I minimize all the datas to 25 seconds. I only took everyone’s “X” values because it’s horizontal to the ground that it shows acceleration changes. I observed that taller they were, they had bigger changes of acceleration between each steps and took less steps. On the other hand, shorter peole had more stable acceleration and took more steps. I predict that this was because shorter people had shorter legs that caused them to take more step even when they walk in same amount of time. However, taller people needed greater acceleration than shorter people because it take more effort and force to move their heavy and long legs forward. 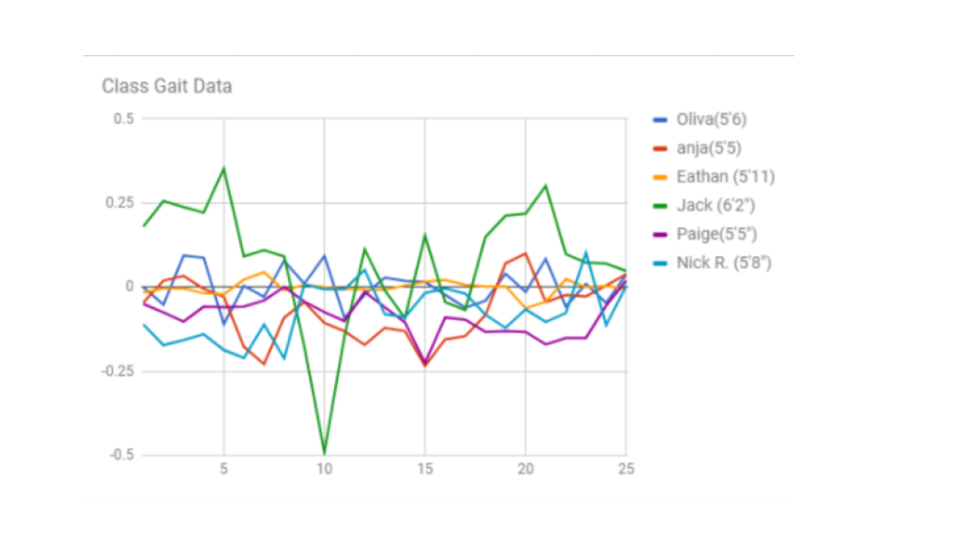
|
Group Gait Analysis
https://docs.google.com/spreadsheets/d/1HNLsjzTxQ2x_k4v8fCN1Eekx2SePebgFGiRs7SlvEPI/edit#gid=0 1) downloaded an accelerometer app and put our phone to our stomach 2) Recorded the data/what happened between 7 steps 3) measured height, leg length, and distance walked. 4) repeated three trials to have an accurate data New/Unknown Data
We were given three unknown data to analyze and figure out whether they were data of Kids or adults. I analyzed the gait data by looking at graphs. I compared the column graphs of children and adults. I found out that the children had higher average gap(ex:AVG-A_GapV) and longer average step time(ex:AVG-Step_Time). My partner and I made a conclusion that this was due to children having shorter legs. Since they have shorter legs, it requires them to take more and slower steps than adults. Then I looked at the unknown datas and found out that unknown 1 and 3 had higher average gap and longer average step time than unknown 2. Also, unknown 1 and 3 had similar AVG-A_GapV and AVG-Step_Time to Child 1, 2, 3, and 4. Only unknown 2 had similar AVG-A_GapV and AVG-Step_Time to data of Adult 1, 2, 3, and 4. |
Terms
accelerometer: A device that measures the physical acceleration experienced by an object.
dynamicity: In terms of gait analysis, the quantification of variations in kinematic or kinetic parameters within a step.
gait: The stride of a human as s/he moves his/her limbs.
metric: A quantitative indicator of a characteristic or attribute.
model: In technology, a description of observed or predicted behavior of some system, simplified by ignoring certain details. Models allow complex systems to be understood and their behavior predicted.
symmetry: The quantification of differences between left-foot and right-foot steps.
variability: The quantification of fluctuations from one stride to the next.
Reflection
Overall, the project was very challenging because I wasn't very used to using google sheet. It required a lot of researching and asking questions, but I definitely improved in my computer skills.
There were few challenges in the quality of data. This was due to all groups having different distance walked, amount of steps took, foot size, and places where they put the phone. Therefore, it was very hard to compare between datas. However, I found a way to minimize the "differences" to compare them.
My team work really well together. We listened and helped each other to finish the project successfully.
We didn't collaborate with other teams to solve any problems because we were able to figure out by collaborating as a team. However, I helped and shared our methods with other teams.
It's very important to have a right data because it will give an accurate result. If we want to compare between teams, we need to know and have a set guideline to begin with constant variables(Independent Variable-variable that never changes during experiments)
The challenges we encountered are listed above. We mostly struggled with comparing our data with other groups'.
I had problem splitting the data into different columns, but through research and asking questions, I was able to answer all my questions and problems.
